Experiments in PRISM
It is recommended that you review the PRISM Overview section before reading this section.
Experiment and Analysis Overview
The primary goals of the experiment management system are to define experiments, define what is planted in each field, provide the ability to exchange reps with other projects/stations, provide the ability to record data for each plot, provide the ability to record overall data on the field, and to feed data into the statistical analysis.
The primary goal of the statistical analysis is provide you with information to make sound decisions on which lines to advance.
To accomplish these goals, PRISM consists of the books described below.
The primary goal of the statistical analysis is provide you with information to make sound decisions on which lines to advance.
To accomplish these goals, PRISM consists of the books described below.
Experiment Entry List Books (Experiment Books)
The Experiment Entry List books allow you to:
- Define the pedigrees/hybrids/varieties in the experiments
- Define the randomization method for the experiment (RCB, Grouping, Incomplete Blocks, Square Lattice, Generalized (alpha) lattice)
- Define any treatments (herbicides, pesticides, etc) and treatment type (split-plot or factorial)
- Assign one or more checks including repeating checks
- Create and randomize reps
- Import Randomizations from Excel or manually enter a randomization
- Move reps to other field books if necessary
- Easily make substitutions in one or more reps using Drag and Drop
- Create advanced experimental designs
- Lock entries or checks in place so they are not randomized
- Provide the General Features discussed in the PRISM Overview
Experiment Worksheet
A special book, called the Experiment Worksheet, helps you plan your experiments. It gives you an overview in a matrix-like interface of how much of each entry list (experiment) is required and the total number of entries for all the experiments currently placed in the field. Some features of the worksheet are:
- Gives you an overview of where each experiment will be planted and what will be planted in each field
- Allows you to easily create experiments and create reps of the experiments in fields
- Give experiments to another breeder to plant with just a few mouse clicks
- Randomize reps
- Manually randomize reps if desired (also ability to paste a randomization from the clipboard and the ability to import randomizations from Excel files)
- Easily move reps from one field to another without losing randomizations
- Duplicate experiments and field books from a prior year
- Easily exchange experiments with other PRISM users with PRISM Experiment Exchange files
Experiment Field Books and Maps
Experiment Field Books are built by creating reps in the field book from the entry list book or from the worksheet. Some features of the Experiment Field books are:
Merge collected data such as yield and moisture into the book. (Merge is found in other books too)
Merge collected data such as yield and moisture into the book. (Merge is found in other books too)
- Define field specific information to track such as zone, previous crop, state, etc.
- Ability to calculate traits such as Yield (can turn off calculations on a field by field basis if desired - sometimes necessary if cooperators provide the calculations)
- Provide the General Features discussed in the PRISM Overview
- Easily place reps to assign range and row coordinates
- Provide complete control over where each plot is placed
- Specify planting order such as Serpentine, Left to Right, Top to Bottom, Vertical Serpentine
- Discard plots, place filler, block sections of the field
- Make planting corrections such as flipping two or more plots, shifting plots, swapping plots, etc. with just a few clicks.
- Color code and assign labels
- Show planting direction to avoid confusion during planting
- Ability to click on a plot in the map and see the underlying Pedigree and other field book information
- Ability to view any data column in the map
- Create harvest and note taking sort orders for the field book (serpentine, vertical serpentines, circular sorting)
- Print maps on one or more pages to use as a planting guide
- Print a Pick Sheet to assist in planting preparation
- Plot or print collected data such as yield and moisture
- Smooth collected data to look for field anomalies
- Plot Z-score information from the statistical analysis module
- Export data or Z-scores from the statistical analysis in "map format" (can be used to build 3-D charts in Microsoft® Excel)
- Export the map in graphical format for communicating with others
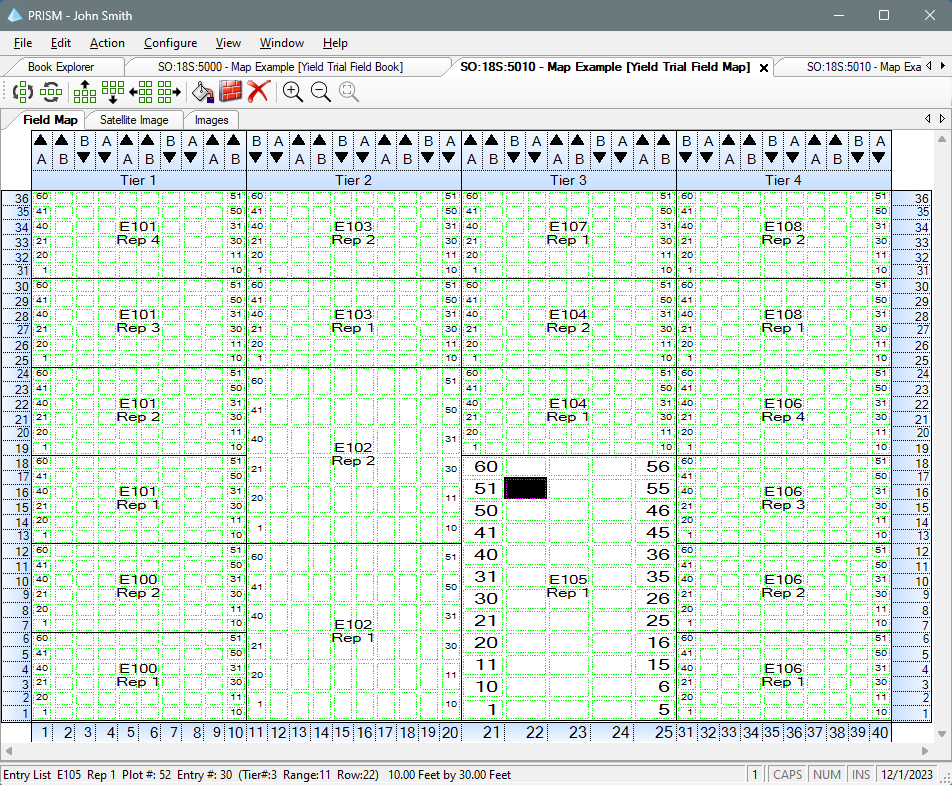
Shown below is a sample Experiment Field Map layout:
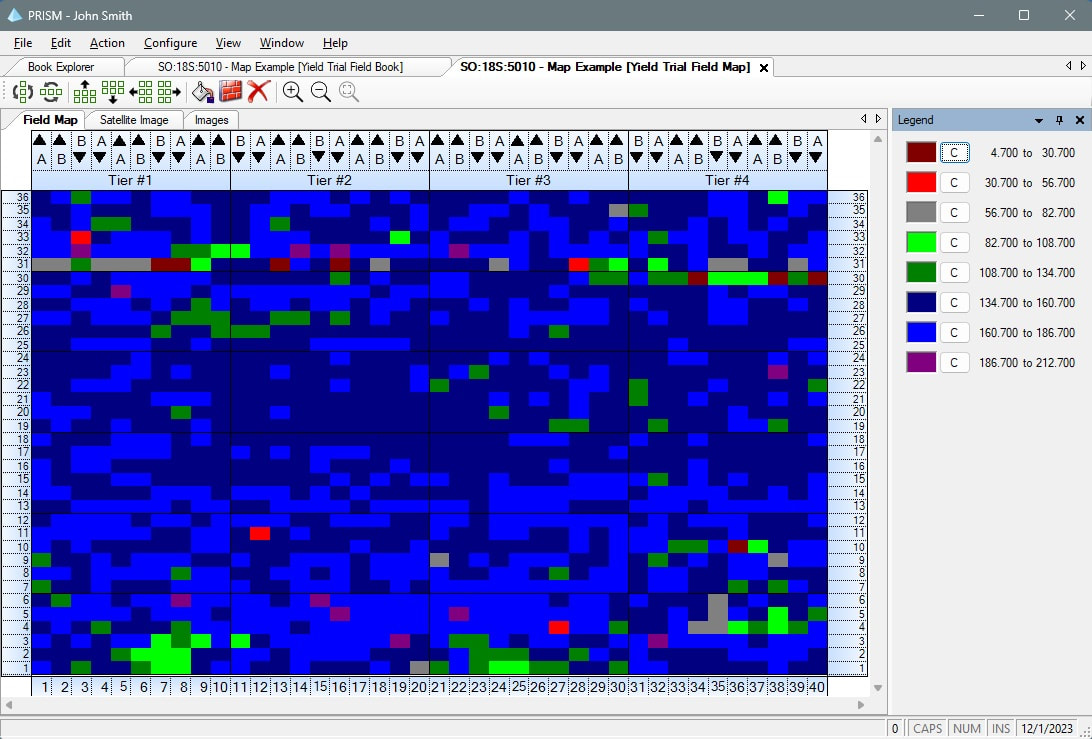
Shown below is a sample Experiment Field Map plotting collected data:
Test Strip (Strip Trial) Field Books
Test Strip Field Books are used to record which hybrids/varieties will be tested in a test strip or strip trial at a particular location. Test Strip Field Books can be built by dragging and dropping records from an Inventory book (or other test strip book) or by importing from a Microsoft® Excel or CSV file. You can define your own data columns such as Plot Weight and Moisture. The data for these columns can be manually entered or they can be merged from an outside file, such as an Excel file.
A Field Notes Book is available from each test strip book that allows you to record agronomy information for that field such as date planted, soil type, previous crop, etc. Just like the other books in PRISM you can specify which traits you wish to track in the Field Notes.
A Field Notes Book is available from each test strip book that allows you to record agronomy information for that field such as date planted, soil type, previous crop, etc. Just like the other books in PRISM you can specify which traits you wish to track in the Field Notes.
Statistical Analysis
The primary goal of the statistical analysis is to provide you with information to make good decisions on your experiment results. Some features of the statistical analysis are:
Click the icons below to view samples.
- Entry Summaries (mean, %mean, %check, rank, standard deviation, CV, SEM, etc).
- Individual Location & Multiple Location summaries
- Rep Summaries (mean, min, max, standard deviation, CV, etc)
- Experiment Summaries (means, standard deviation, CV, ANOVA, LSD, F-values, etc)
- Across Location ANOVA Analysis (CV, ANOVA, LSD, F-values, SS, etc.)
- GxE Analysis
- Stability Analysis
- Nearest Neighbor Analysis
- Incomplete Block Analysis
- Lattice and Generalized (alpha) Lattice
- MAD Type 1 and MAD Type 3 Analysis
- Type I or Type III (GLM) SS (Sum of Squares)
- Missing Value Reports
- Outlier Reports
- Paired (or Grouped) Comparisons Reports (Head to Head). Can run as 1 to 1, 1 to many, or many to many. Can automatically breakdown by a field notes criteria such as Zone.
- Plots results on a geographical map that you configure (such as Upper Midwest)
- Save commonly used head to head comparisons and hybrid/variety reports criteria for quick re-running of the report
- Regression/Stability Analysis
- Hybrid/Variety Reports (mean, %mean, %check, etc)
- Line x tester
- Calculate Relative Maturity
- SCA and GCA reports
- Rank Analysis reports
Make decisions in analysis reports and transfer the decisions to nurseries - Ability to control the layout of the reports
- Ability to calculate columns such as Yield (either defined by you in the column definition or tailored for your company in the Pedigree Engine)
- Filter on field information you defined and tracked such as Zone, Previous Crop, State, etc.
- Test Strip Field Summaries (means, standard deviation, CV)
- Test Strip Entry Summaries (%field mean, %check, data value)
- All reports can be viewed in the print preview window, sent to a printer, or exported to Microsoft® Excel, Microsoft® Word, Adobe® Acrobat®, or HTML (web format).
- Place your own picture/image on the header and/or footer of the reports
Click the icons below to view samples.
Virtual Experiments
A Virtual experiment is similar to a Head to Head except that it allows more than two entries. In a virtual experiment you define the hybrid/variety for each entry. When an analysis reports is run against a virtual experiment, PRISM will search for all experiments (and test strips if you desire) where the materials you specified occur together. You can use the standard experiment reports for virtual experiments such as the Entry Summary Reports and Across Location ANOVA reports. Virtual experiments can be run across years if desired.
Analysis E-mail
In additional to running reports interactively, you can also submit reports to the PRISM Service freeing your machine for other tasks. Some features of this are:
- Ability to queue all analysis reports for automatic, unattended generation
- Automatically email the reports to you or a group
Experiment Customization
PRISM can also be used by your sales staff. A variety of ways are available for your sales force to connect to the database. A hybrid of a multiple user database and standalone databases can also be implemented. This allows your researchers to have a centralized database for data management and standalone databases with published results available for your sales force. Contact Central Software Solutions for further information on providing databases for your sales staff.
CSSI can provide statistical analysis and reporting customization including:
CSSI can provide statistical analysis and reporting customization including:
- Product customization including additional statistical analysis
- Local head to head and analysis reporting databases for sales staff that resides on their computer
- Integration with your statistical analysis package


